Valar's own safety numbers, worked through step by step from its published documents: the inputs, every step of the arithmetic, the result, and what it means in plain terms.
Each proof takes a number from Valar's own published documents, shows every input and every step of the arithmetic, and ends in plain language. Every input is labelled by origin: Valar's (most come from its October 2025 draft safety agreement, not the DOE-approved safety analysis, which was not found in public records), DOE's, a standard reference, or our own assumption or calculation. No measured Ward 250 dose was found in public records, so none appears here. A proof is published only after an independent check has tried to refute it. Where a document leaves out the inputs a calculation needs, the proof says so rather than guess.
The 400 m public-access line: bigger than the lab's land, and a state highway runs inside it
Ward250 Nuclear Safety Design Agreement, No. 100403 Rev 02 (Valar Atomics, Oct 2025) · pp. 10-11 and 37-39 · The document's assumption vs the ground
What the document says
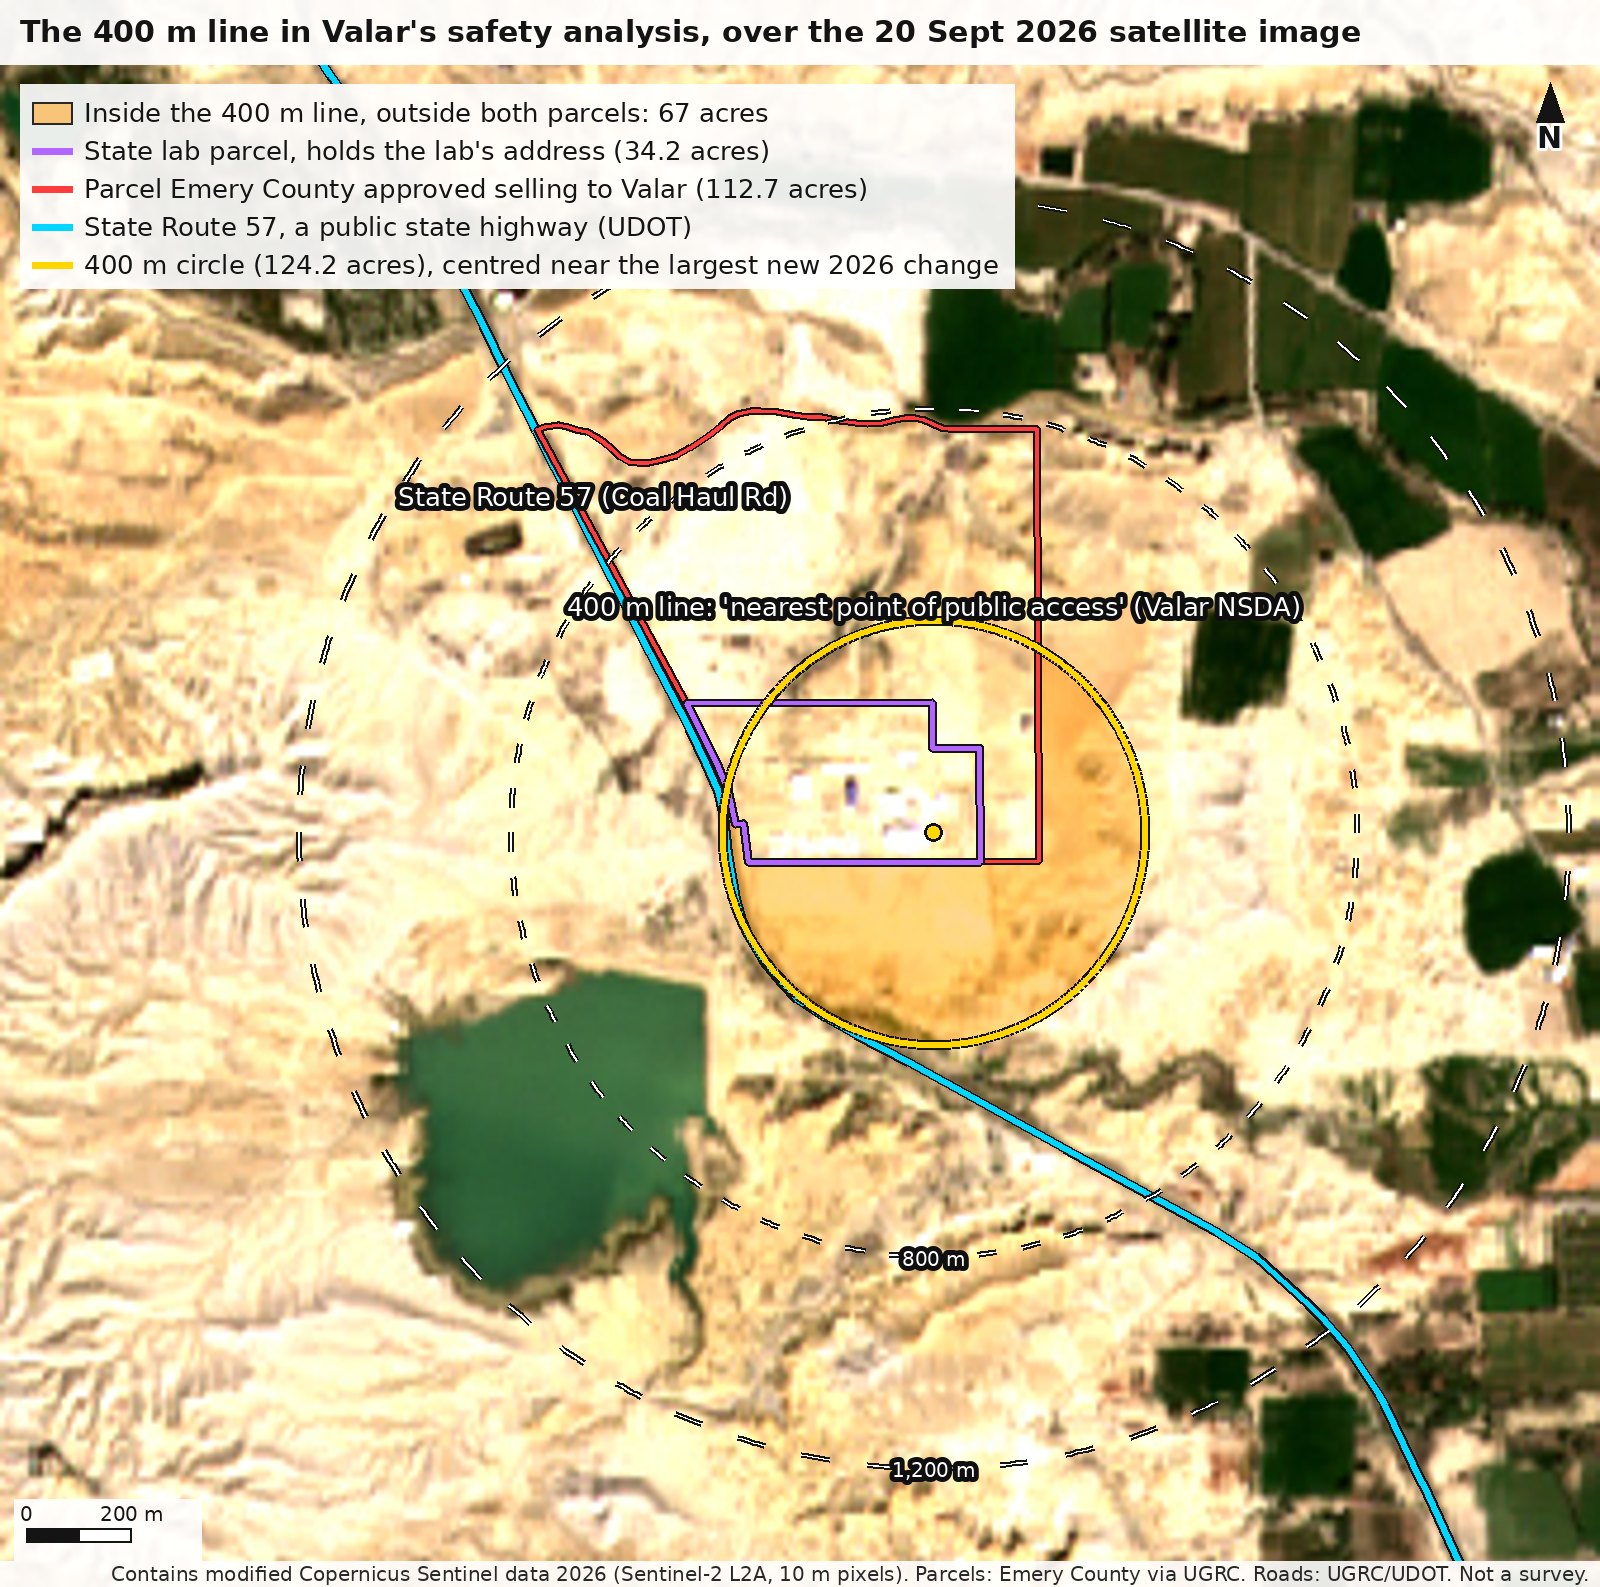
Valar's accident analysis computes public doses at a site boundary 400 m from the reactor, which it calls 'the nearest point of public access', with the nearest residence at about 800 m and the nearest group at 1,200 m. It concludes the 400 m boundary 'provides adequate protection with substantial margin'.
Given
r = 400 m, the distance to the nearest point of public access (NSDA pp. 10-11, 37-39)
1 acre = 4,046.856 m² (43,560 square feet; 1 ft = 0.3048 m exactly) (definition)
A_site = 20.6 acres, the lab site DOE describes (DOE categorical exclusion DOE-ID-26-005)
A_lab = 34.25 acres, the state lab parcel 04-0019-0029 (State of Utah DFCM) that holds the lab's address (Emery County parcel map via UGRC (outline); the state's government-owned-parcel layer records 34.2 acres (the county layer gives no acreage for this parcel))
A_valar = 112.72 acres, parcel 04-0019-0030, which Emery County approved selling to Valar (Emery County parcel map via UGRC)
SR 57 = Coal Haul Road beside the lab: State Route 57, a UDOT state highway (funding class A), paved, 65 mph, no gate or authorized-only flag (UGRC/UDOT road centerlines)
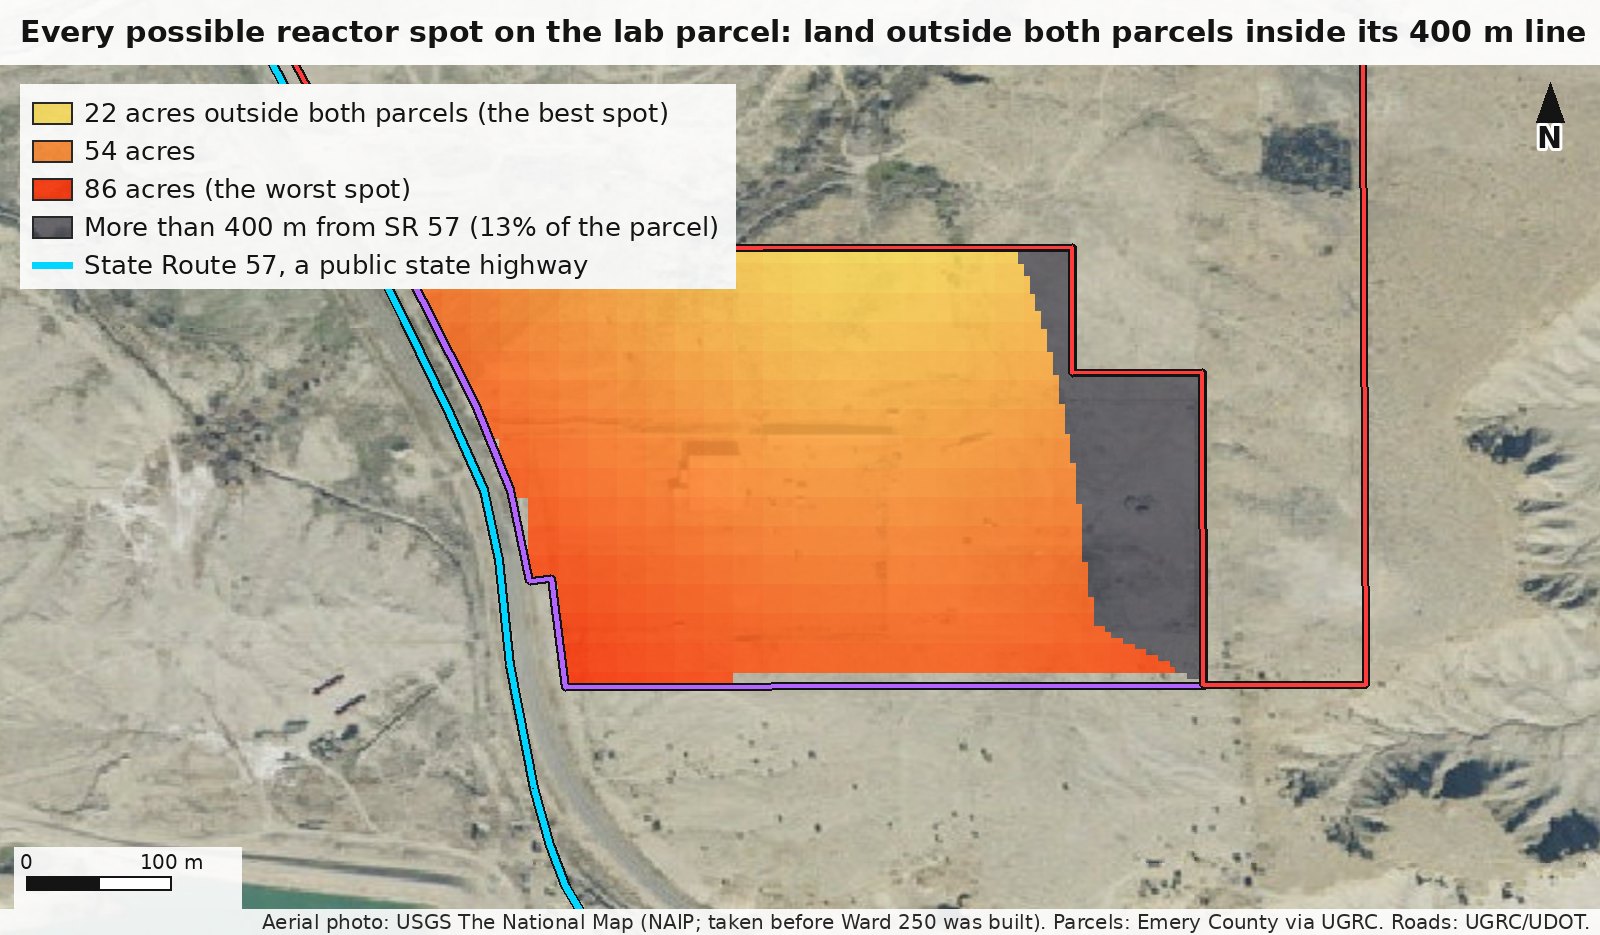
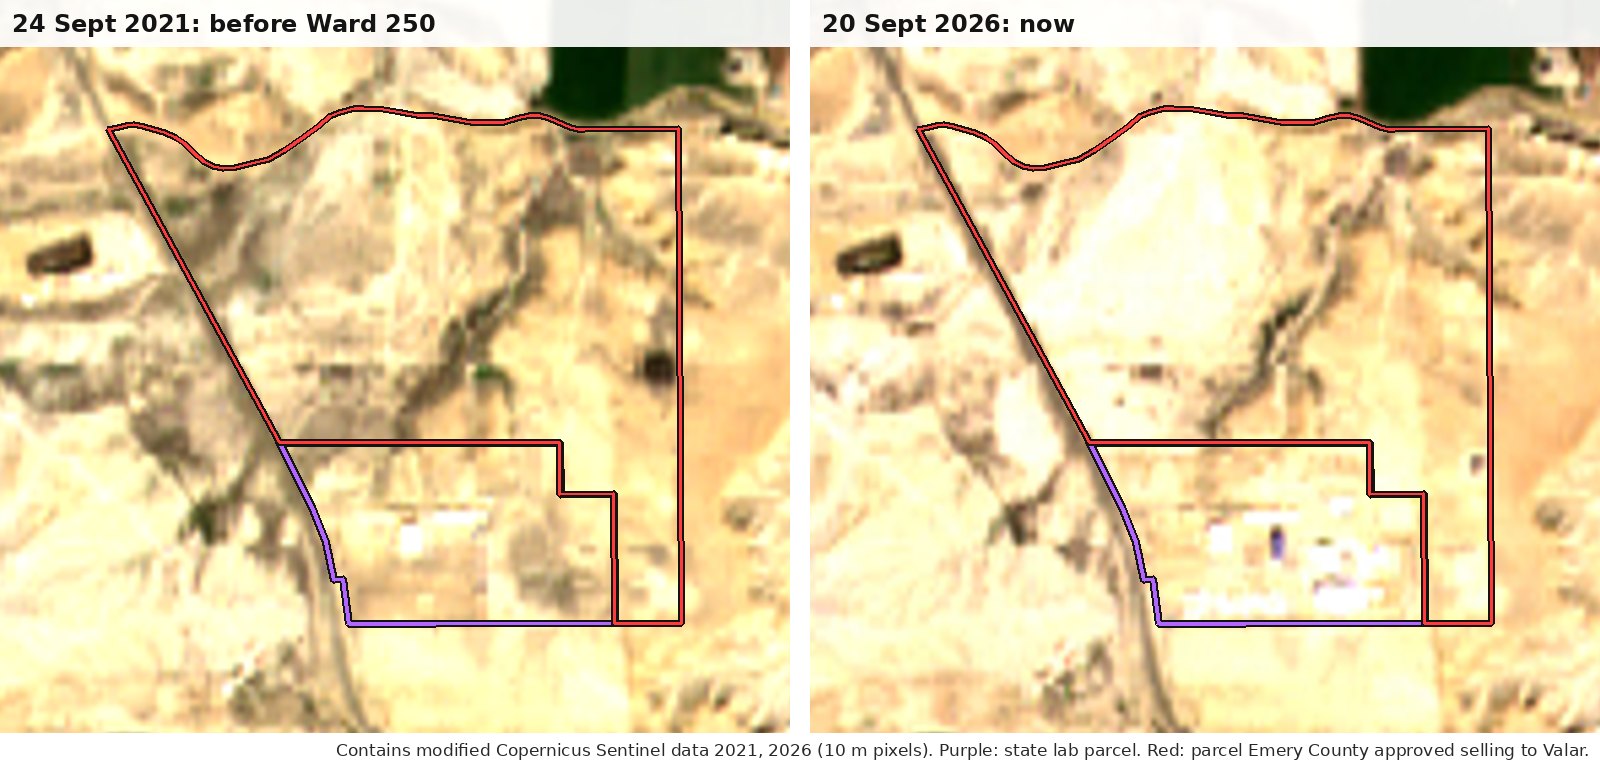
Figure 1. The 400 m line (yellow) around a point we picked in the largest patch of ground that changed on the lab parcel between Sept 2021 and Sept 2026, probably the new Ward 250 compound; the reactor itself cannot be made out at 10 m pixels. DOE's public records do not give the reactor's exact spot, so Figure 2 checks every spot. Orange: land inside the line that is outside both parcels (67 acres for this centre; about 61 acres if the circle is centred 40 m north-west, at the middle of the changed patch). Blue: State Route 57. Dashed rings: 800 m and 1,200 m, the NSDA's nearest-residence and nearest-group distances. Contains modified Copernicus Sentinel data 2026 (Sentinel-2 L2A, 20 Sept 2026, 10 m pixels), processed via Microsoft Planetary Computer.Figure 2. Every 20 m square of the lab parcel treated as the reactor's spot, coloured by how many acres of its 400 m circle fall outside both parcels: about 22 acres at best, 86 at worst. Grey: the 13% of the parcel more than 400 m from State Route 57. Aerial photo: USGS The National Map orthoimagery (NAIP; the service gives no acquisition date and was last refreshed June 2024, before Ward 250 was built).Figure 3. Same place, same season, 24 Sept 2021 and 20 Sept 2026: new structures or cleared ground on the lab parcel. Sentinel-2's 10 m pixels show that something was built, not the reactor itself. Contains modified Copernicus Sentinel data 2021, 2026, processed via Microsoft Planetary Computer.
Working
A_circle = π r² = π × (400 m)² = 502,655 m²
Everything within 400 m of the reactor is a circle of radius 400 m.
502,655 m² ÷ 4,046.856 m² per acre = 124.21 acres
The zone the analysis assumes the public stays out of.
124.21 ÷ 20.6 = 6.0 124.21 ÷ 34.25 = 3.6
The zone is 6 times the site DOE describes and 3.6 times the whole lab parcel, so the 400 m line must cross land outside the lab wherever the reactor is.
34.25 + 112.72 = 146.97 acres > 124.21 acres
Adding the parcel Emery County approved selling to Valar gives more area than the circle, so area alone does not settle it; the shapes do.
For each spot c on the lab parcel: A_out(c) = A_circle − A(circle ∩ lab) − A(circle ∩ Valar parcel)
5,569 spots on a 5 m grid covering the parcel. Each circle was clipped against the official parcel outlines (Sutherland-Hodgman clipping on a 180-sided circle; the best spot re-done with 1,440 sides). A second method, counting 2 m grid points inside each circle, agrees within 0.05 acre.
min A_out = 21.8 acres (18%) median ≈ 56 acres max = 86.5 acres (70%)
Even the best spot for Valar, on the lab parcel's north edge, leaves 21.8 acres inside the line on other land (the best 5 m grid spot gives 21.9; refining it to 0.2 m gives 21.8). None of that land is listed as government land in the state's government-owned-parcel layer; the county data we can read does not name the owners.
d(spot, SR 57) over 5,569 spots (5 m grid): min 17.2 m, max 496.2 m; d ≤ 400 m for 86.7% of the parcel
State Route 57 runs along the lab parcel's west edge; the parcel's edge comes within about 16 m of its centreline. At the lab's address point it is 149 m away; in the largest patch of new 2026 change, about 365 to 390 m depending on the exact point, just inside the line.
Nearest residential address point: 987 m from the lab parcel's edge; none within 800 m
Credit where due: the NSDA's '800m to nearest residence' (p. 10) is on the safe side. (Counted from the state's address points typed Residential; no address is shown. No address point of any type other than the lab's own lies within 800 m.)
Result
Wherever Ward 250 sits on the lab parcel, at least 21.8 acres inside its 400 m line lie outside both the state lab parcel and the land Emery County approved selling to Valar, and for about 87% of the possible spots part of SR 57, a public state highway, lies inside the line. The nearest address point the state lists as residential is 987 m from the lab parcel, farther than the 800 m Valar assumed.
In plain terms: Valar's October 2025 safety agreement, marked draft, works out accident doses for the public at 400 meters, about a quarter mile, from the reactor, which it calls 'the nearest point of public access'. A 400-meter circle covers 124 acres, six times the 20.6-acre lab site DOE describes. Even counting the land Emery County approved selling to Valar as Valar's, at least 22 acres of the circle lie outside both, wherever on the lab parcel the reactor sits. For about 87% of the possible spots, the circle also takes in part of SR 57, a paved state highway with a 65-mph limit and no gate recorded. Valar's side: its paper puts the worst-case public dose at 400 meters far below the 25-rem guideline it cites. DOE says its approved safety analysis, of which no public copy was found, keeps offsite doses well below DOE guidelines and that access is controlled during operations, without saying where. No DOE record read sets 400 meters as a required boundary; it is the distance Valar's draft paper chose for its public-dose math. Closer in, doses would be higher. The nearest address point the state lists as residential is about a kilometer from the lab parcel, farther than the 800 meters Valar assumed, which is good news. The open question: who keeps the public out of the rest of the 400-meter zone, including the highway, or does DOE's approved analysis use a different boundary?
Checked: We re-pulled the parcel, road, government-land and address layers ourselves. We then recomputed every area with an exact circle-and-polygon method in a different map projection, and checked it against a fine raster count. We re-read the quoted pages of Valar's safety agreement and DOE's determination as page images. We also redid the satellite change detection. The findings hold; the true minimum is 21.8 acres rather than 21.9, and the captions now disclose how the figure centre was chosen and carry the image attributions. Correction 2026-10-01 (precision review): wording made more exact against the cited records.
The paper's 400 m dispersion factor is 3 to 12 times below the standard rural method for its own stated weather
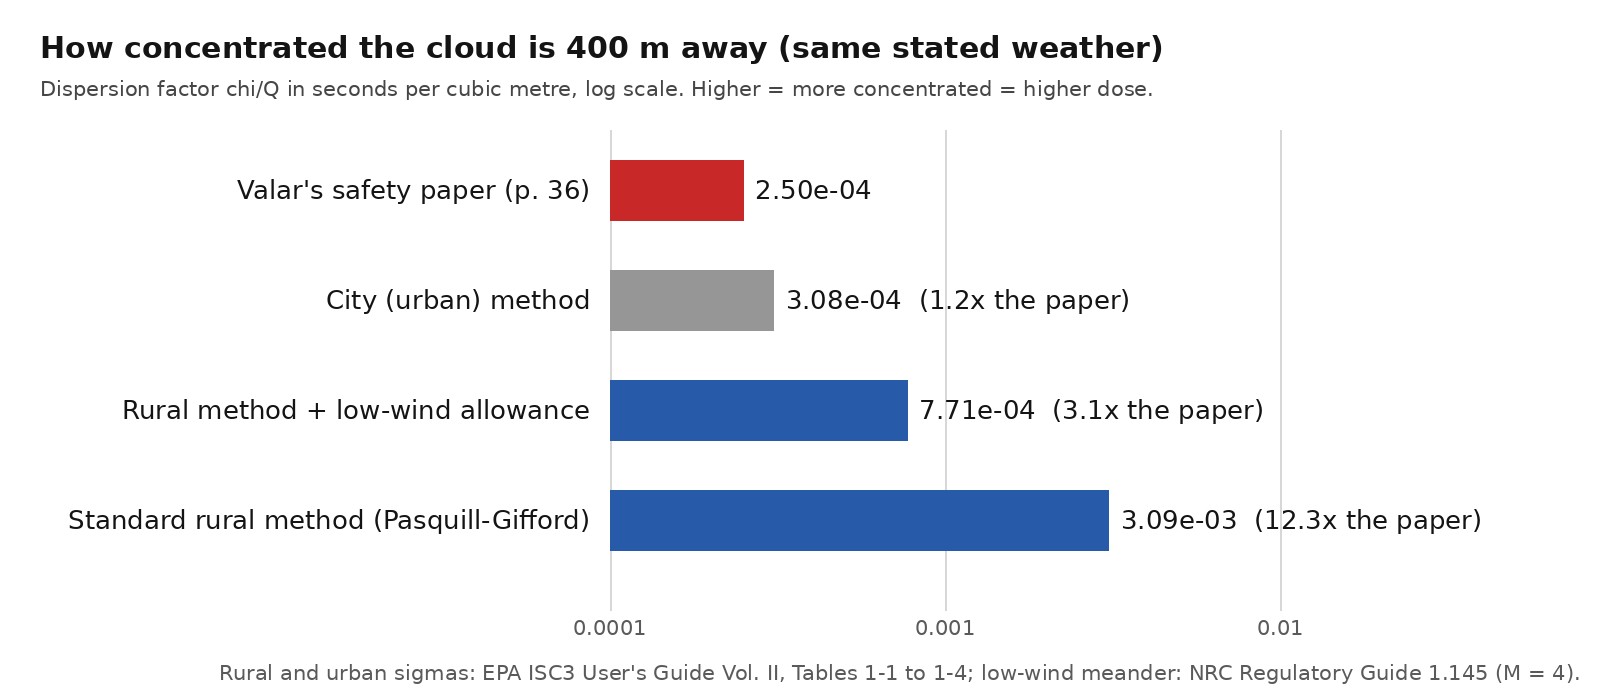
For the worst-case accident, the paper assumes stable night air ('Stability Class F'), a 1 m/s wind, a ground-level release at 1.5 m and no credit for buildings stirring the air, and uses a dispersion factor of about 2.5 × 10⁻⁴ s/m³ at the 400 m boundary. It reports the public dose there as under 1 mSv (0.1 rem), and in an earlier, preliminary section under 0.5 rem, and compares it with a 25 rem guideline and a 1 rem figure it labels 'USNRC NPUF' (Table 4, p. 38).
Given
x = 400 m = 0.4 km, the site boundary (NSDA p. 36)
u = 1 m/s wind speed (NSDA p. 34)
Stability = Pasquill class F ('moderately stable atmosphere') with a 1 m/s wind; ground-level release at 1.5 m; no plume rise or building-wake credit (from: NSDA pp. 11, 34, 36) (NSDA pp. 11, 36)
χ/Q (paper) = 2.5 × 10⁻⁴ s/m³ (NSDA p. 36; Valar's draft value (NSDA Rev 02), not the DOE-approved analysis)
σ_y, σ_z = the standard rural Pasquill-Gifford plume widths for class F (EPA's ISC3 fits) (EPA ISC3 User's Guide, Vol. II, Tables 1-1 and 1-2)
M = 4, the low-wind meander allowance for class F at wind ≤ 2 m/s (NRC Regulatory Guide 1.145 Rev. 1, Reg. Position 1.3.1 and Figure 3 (p. 1.145-9))
Figure. The paper's number beside standard calculations for the same stated weather (log scale). Only the city (urban) method comes close (1.2 times the paper's figure). DOE describes the site as rural, and DOE-STD-3009-2014, which the paper lists among its tailored standards (p. 47), names rural coefficients among its default conservative parameters (Option 2).
Working
χ/Q = 1 ÷ (π · σ_y · σ_z · u)
The textbook ground-level, plume-centreline form of the Gaussian plume model, the model the paper says it uses (p. 11).
θ = 0.017453293 × (4.1667 − 0.36191 × ln 0.4) = 0.07851 rad
σ_y = 465.11628 × 0.4 × tan θ = 14.64 m
Sideways spread at 400 m for class F (EPA ISC3, Table 1-1).
σ_z = 14.457 × 0.4^0.78407 = 7.05 m
Vertical spread at 400 m for class F (EPA ISC3, Table 1-2).
Following RG 1.145's rule (take the higher of Eqs. 1 and 2, then the lower of that and Eq. 3), this is the most generous allowance NRC guidance gives for class F in light winds: still 3.1 times the paper's number. DOE-STD-3009-2014 allows meander only 'consistent with the accident release duration', and the paper assumes an instantaneous release (p. 34).
u needed for 2.5 × 10⁻⁴ = 3.09 × 10⁻³ ÷ 2.5 × 10⁻⁴ × 1 m/s = 12.3 m/s
... Longer averaging times do not close the gap: DOE-STD-3009-2014 sets a nominal 2-hour exposure (8 hours at most), and even a 24-hour correction (σ_y ∝ t^0.2 from a 10-minute base) leaves it 4.6 times low. Curves that do reach 2.5 × 10⁻⁴: the urban (city) family at about 451 m, or rural curves with the class F meander allowance at about 780 m (2.40 × 10⁻⁴ at 800 m, the paper's nearest-residence distance). The paper names neither.
Dose scales with χ/Q: 0.1 rem × 3.1 = 0.31 rem; 0.1 rem × 12.3 = 1.23 rem
0.5 rem × 3.1 = 1.5 rem; 0.5 rem × 12.3 = 6.2 rem
Table 4 margin against 1 rem: '>10×' becomes about 3.2×, or below 1
... The 1 rem figure matches one of the NRC's two criteria for sizing an emergency planning zone for NRC applicants (1 rem over 96 hours, 10 CFR 50.33(g)(2)(i)(A)): a planning test, not a limit. The paper's own case for on-site-only emergency planning (p. 54) rests on its 0.5 rem boundary bound, which rescales to 1.5 to 6.2 rem.
Result
For the weather Valar's paper says it assumes, the standard rural method gives an air concentration at 400 m 12.3 times the paper's figure, or 3.1 times with the low-wind allowance. The public-dose bounds scale up by the same factors: still below the 25 rem guideline, so the paper's no-Safety-Class conclusion holds, but the 1 rem figure the paper cites (the NRC's emergency-planning-zone test for research reactors it licenses) could shrink from more than 10 times to about 3 times, or be lost at the bound. These are bounds, not predicted doses.
In plain terms: Valar's accident math includes a number for how much a radioactive cloud thins out before it reaches the public boundary 400 meters away. For the stable, light-wind weather the paper says it assumes (Class F, 1 m/s wind), the standard method for open country gives a cloud about 12 times more concentrated than Valar's number, or about 3 times with the most generous low-wind allowance NRC guidance gives for that weather. Valar's number is close to what the method for cities gives, or to what the low-wind method gives at about 800 meters, the paper's nearest-residence distance. The paper does not say which method it used. If its doses were built on that number, the worst-case public dose at 400 meters could be 3 to 12 times higher than stated: about 0.3 to 1.2 rem instead of under 0.1 rem, or about 1.5 to 6 rem from its earlier, preliminary figure of 0.5 rem. That is still below the 25-rem guideline the paper uses to decide on safety-class equipment. It could erase the margin under the 1-rem figure the paper labels 'USNRC NPUF', and it bears on the paper's case for keeping emergency planning on site, which rests on boundary doses under 0.5 rem (p. 54). Valar's paper calls its weather choice the 'most conservative' and says its accident release far exceeds any realistic one, so these are upper bounds, not predicted doses. No public copy of the final safety analysis DOE reviewed was found; it would show which method DOE accepted.
Checked: We recomputed every number in Python, using fresh official copies of EPA's ISC3 Vol. II coefficient tables, NRC Regulatory Guide 1.145 Rev. 1 (Figure 3 checked on the page image) and DOE-STD-3009-2014 s.3.2.4.2. We re-read NSDA pp. 11, 34-38, 47 and 54 as page images. The 12.3x and 3.1x factors, the 12.3 m/s wind, the 451 m and roughly 780 m fits and the dose rescaling all hold. The corrected wording attributes the paper's own conservatism claims, narrows the emergency-planning statement and fixes the DOE standard citation. Correction 2026-10-01 (precision review): wording made more exact against the cited records.
The fuel: Valar's safety paper says 4.95%; the fuel DOE's shipping review cleared for Ward 250 is up to 19.9%
Ward250 Nuclear Safety Design Agreement, No. 100403 Rev 02; DOE Model 9979 shipping review · NSDA pp. 11, 52; DOE review pp. 2, 5, 9 · Discrepancy
What the document says
The joint Valar-Los Alamos NOVA release on Valar's site calls the NOVA core 'HALEU TRISO-fueled' and says NOVA uses 'the same fuel' as Ward250.
Given
e (paper) = 4.95% U-235 (NSDA Table 6, p. 52)
e (DOE) = up to 19.9% U-235 by weight ('less than 20 weight percent') (DOE Model 9979 review, p. 2 (HALEU, shipments to the Ward 250 site), p. 5 (19.9 wt.% maximum; the same page also says '20.0 wt.% maximum'), p. 9 (condition 4, 'less than 20 weight percent'))
HALEU = uranium enriched from 5% to less than 20% (DOE Office of Nuclear Energy)
Working
19.9% ÷ 4.95% = 4.02
The fuel DOE cleared for shipment to Ward 250 can be about four times as enriched as the paper says.
4.95% < 5% ⇒ not HALEU; 5% ≤ 19.9% < 20% ⇒ HALEU
By DOE's own definition, the paper's figure is ordinary low-enriched fuel and the fuel cleared for shipment is high-assay (HALEU), the grade Valar's NOVA release names for the fuel it says Ward 250 shares.
Copies checked, 7 Nov 2025 to 29 Sept 2026: 8 (seven Internet Archive captures plus the live file), all byte-identical; copies with a different enrichment: 0
No revised public copy was found after DOE's shipping review (20 May 2026) or DOE's 18 June 2026 announcement of Ward 250's first criticality.
Result
The only public safety paper for Ward 250 lists 4.95% fuel, while DOE's shipping review covers HALEU fuel for Ward 250 at up to 19.9%, as much as about four times as enriched. The paper calls its fuel assumptions preliminary, to be checked against Ward 250's actual fuel specifications in a later analysis (the PDSA) and updated if the fuel differs from the AGR-program specification; that analysis is not public.
In plain terms: Uranium fuel is graded by how much of the key U-235 atom it holds. Valar's public safety paper for Ward 250 lists 4.95%, within the range ordinary power plants use (up to 5%). DOE's review of the shipping drums for fuel going to Ward 250 covers HALEU fuel enriched up to 19.9%, as much as four times richer; HALEU still counts as low-enriched because it stays under 20%. Valar's own release on its Nevada test, issued with Los Alamos, also calls its fuel HALEU and says it is the same fuel as Ward 250's. No public record found states what fuel is actually in the reactor. The paper calls its fuel assumptions preliminary and says they will be checked, and updated if needed, in a later safety analysis. That analysis is not public, so no one outside can see which fuel grade DOE's approved safety numbers use. The grade changes the core physics, but the paper's accident doses depend mostly on how much energy the reactor has made (power times running time), so the grade alone would change those dose estimates little. Every public copy of the paper found, from November 2025 to September 2026, still says 4.95%.
Checked: We re-read NSDA pages 11, 26 and 52 and DOE's shipping review (pages 1, 2, 5 and 9) as page images, re-fetched DOE's HALEU definition and Valar's NOVA release, and downloaded every Internet Archive copy of the safety paper: all 8 public copies are byte-identical and say 4.95%. The ratios and the energy-to-fission arithmetic were recomputed in Python.
The temperature: a goal 100 °C above its own limit
The paper sets 'Maximum outlet temperature: 650°C' as a safety limit (p. 25; Table 6, p. 52, '650°C nominal'). Its objectives say 'Demonstrate core outlet temperatures of 750°C under normal operations' (p. 8), and its creep check uses 750 °C as the 'maximum operating temperature' (p. 49).
Given
T_limit = 650 °C (NSDA p. 25 (§5.4 safety limit); p. 52 (Table 6, '650°C nominal', basis 'Material limits'))
T_goal = 750 °C 'under normal operations' (NSDA p. 8)
Working
T_goal − T_limit = 750 °C − 650 °C = 100 °C
The stated goal exceeds the stated limit.
Creep check at 750 °C ≥ 650 °C limit
The vessel creep check uses the higher figure. Creep worsens with temperature, so the check also covers operation at the 650 °C limit. The gap is an inconsistency in the paper, not evidence of unsafe operation.
Result
One paper gives two outlet temperatures for normal operation, 100 °C apart: a 650 °C safety limit (p. 25) and a 750 °C goal (p. 8). Within the paper, the safety limit outranks the goal. The Technical Safety Requirements that set actual operating limits were planned for submittal on 6 January 2026 (p. 20); no public record of them found.
In plain terms: Valar's safety paper sets a limit: the gas leaving the reactor core may not go above 650 °C (p. 25). Its list of goals also says 750 °C 'under normal operations' (p. 8), 100 degrees over that limit. Valar's own web summary of the paper sides with the limit: it says testing 'at temperatures up to 650°C'. One possible reading is an out-of-date goal line left in a draft; the paper itself does not say. This is an inconsistency in the paperwork, not a sign of unsafe operation: within the paper, 650 °C is the safety limit, and the steel-vessel check was run at the hotter 750 °C, which is the cautious direction. Anyone quoting Ward 250's temperature should use 650 °C. The operating limits that would settle it are the Technical Safety Requirements, which the paper planned to submit to DOE on 6 January 2026 (p. 20). We found no public record of them.
Checked: I compared the source PDF fetched on 2026-09-29 against the audited copy (identical SHA-256) and re-read NSDA pp. 8, 20, 25, 49 and 52 as page images. Every quote is exact, and 750 − 650 = 100 °C was recomputed in Python. Valar's web summary ('up to 650°C') was confirmed and added as Valar's side, and the closing paragraph was reworded so it does not claim more than the paper shows about which figure binds.
How long it may run: the accident inventory assumes one tenth of the paper's own limit
The paper's limit is 'Fuel burnup limit: 30 megawatt-days' (p. 25). Its worst-case accident inventory is built on '3 MWd total burnup' from 'Conservative 30 EFPD operation' (p. 34).
Iodine-131 is already 92.5% of its steady level after 30 days, so the nuclide the paper names 'primary dose contributor' (p. 34) barely changes; long-lived nuclides grow almost in proportion to total running. Counting the other iodines and the noble gases, the combined inhalation-plus-cloud dose rises about 4 to 5% (estimate from standard fission yields and EPA dose coefficients).
Result
The accident inventory the paper calls conservative covers one tenth of the burnup its own limit allows. For iodine-131, which the paper names as the primary dose contributor, the difference is about 8%; for long-lived cesium-137 and strontium-90, about ten times (constant power assumed).
In plain terms: The more a reactor runs, the more radioactive material builds up in its fuel. Valar's October 2025 draft safety agreement builds its worst-case accident on 30 days at full power, which it calls conservative. The same paper's own limit allows ten times that, about 300 full-power days. For iodine-131, which the paper names as the main dose contributor, that adds only about 8%, because iodine levels off within weeks. Long-lived cesium-137 and strontium-90, which matter for cleanup, grow about ten times. Valar's July 2025 county slides and its June 2026 web page both describe 30 full-power days, which matches the accident math. The paper's goal of 12 months of operation at over 80% availability would come close to the larger limit. Which figure DOE approved cannot be checked: no record found of the final safety analysis in public.
Checked: Every number was recomputed in Python. 0.1 MW x 30 d = 3.0 MWd, and 30 MWd at 0.1 MW = 300 full-power days. Growth factors from NuDat 3 half-lives: I-131 x1.081, Cs-137 x9.92 and Sr-90 x9.91, with a combined iodine plus noble-gas dose of x1.044. The quotes on NSDA pp. 8, 25 and 34 were checked against page images of the live PDF. Valar's 30 full-power-day statements were confirmed on its June 2026 web page and its July 2025 county slides.
The on-site-only emergency request cites a 0.5 rem whole-body figure; the paper does not address EPA's thyroid (potassium iodide) guide
Ward250 Nuclear Safety Design Agreement, No. 100403 Rev 02; EPA Protective Action Guides (2017) · NSDA pp. 11, 20-21, 36, 37, 45, 54; EPA PAG Manual 2017 pp. 6, 15; FGR 11 p. 136 · Method problem
What the document says
Valar asks DOE for 'On-site emergency response only' (pp. 45, 54). Its dose justification: 'MHA analysis demonstrates site boundary doses <0.5 rem TEDE, well below Protective Action Guidelines' (p. 54); it also cites the 800 m distance to the nearest residence, a limited source term and a short operating period. The paper names 'I-131 (thyroid), noble gases (external)' as primary contributors to the 400 m dose (p. 37).
Given
D = 0.5 rem whole-body (TEDE) at 400 m, the figure the emergency argument uses (NSDA pp. 11, 54 (p. 11 places the site boundary at 400 m); Valar's draft value (NSDA Rev 02), not the DOE-approved analysis)
PAG = 1 to 5 rem projected dose for shelter or evacuation; 5 rem child thyroid dose for potassium iodide (KI) (EPA PAG Manual 2017, Table 1-1)
Thyroid ÷ whole body = about 16 to 27 for the paper's noble-gas-plus-iodine release, with the gases escaping in fuel-inventory proportion (26.9 with FGR 11 weighting; about 16 to 18 with the 0.05 thyroid weighting of DOE's 10 CFR 835.2). Iodine-131 alone: 2.92 × 10⁻⁷ ÷ 8.89 × 10⁻⁹ Sv/Bq = 32.8 (FGR 11 Table 2.1, adult inhalation, p. 136) (EPA FGR 11 Table 2.1 (p. 136); 10 CFR 835.2 tissue weighting factors; inventory proportions: our own calculation, assuming gases escape in fuel-inventory proportion as the paper's release assumption suggests (p. 36); not a Valar or DOE value)
Working
Whole-body margin: 1 rem ÷ 0.5 rem = 2
'Well below' the lowest EPA guide for sheltering or evacuating is a factor of two.
Iodine-131: 2.92 × 10⁻⁷ ÷ 8.89 × 10⁻⁹ = 32.8; noble-gas-plus-iodine mix in fuel-inventory proportion: 26.9 (FGR 11 weighting, thyroid 0.03) or about 16 to 18 (thyroid 0.05, as in 10 CFR 835.2)
If iodine and noble gases escape in proportion, as the paper's failed-fuel assumption suggests ('100% of gaseous and volatile inventory', p. 36), iodine supplies about nine-tenths of the dose and the thyroid dose is many times the whole-body figure.
Adult thyroid ≈ 0.5 rem × 16 to 26.9 = 8 to 13 rem > 5 rem; child: roughly twice that (EPA PAG Manual s. 2.2.1, p. 15)
If a release reached the paper's 0.5 rem and was driven by iodine, the child thyroid dose would be above the 5 rem level at which EPA says KI should be considered. The child figure stays above 5 rem as long as iodine supplies more than about a quarter of the 0.5 rem. The paper does not mention potassium iodide or give a thyroid dose.
With the paper's other figure, 0.1 rem: child thyroid ≈ 3 to 5 rem
At the tighter figure (400 m, p. 37) the child thyroid dose is at or just under the guide; the emergency argument on p. 54 does not use it. If the dispersion factor is understated (proof pf-002), both figures would rise.
Result
The paper's dose argument for on-site-only emergency planning uses its looser 0.5 rem figure (p. 54; it also cites the 800 m distance to the nearest residence, a limited source term and a short operating period). If iodine and noble gases escape in fuel-inventory proportion, as the paper's failed-fuel assumption (p. 36) suggests, that figure implies roughly 8 to 13 rem to an adult thyroid at the 400 m boundary and about twice that for a young child, above EPA's 5 rem potassium-iodide guide. The child figure stays above 5 rem as long as iodine supplies more than about a quarter of the dose. The paper does not mention potassium iodide or give a thyroid dose. These are upper bounds derived from Valar's stated ceiling; Valar says its source term 'substantially exceeds any realistic release scenario' (p. 11). At the paper's other boundary figure, 0.1 rem (p. 37), the child thyroid dose is about 3 to 5 rem. Valar says DOE approved the NSDA (13 October 2025); no DOE record of what DOE accepted on emergency planning was found.
In plain terms: Valar's October 2025 safety agreement asks DOE to let it plan for emergencies on its own site only, with no off-site plan, coordinating with Emery County responders instead. Among its reasons: the worst-case dose at the 400 m site boundary would be under 0.5 rem, 'well below Protective Action Guidelines.' EPA's guide for sheltering or evacuating starts at 1 rem, only twice that. The paper also names iodine-131, which collects in the thyroid, as a main contributor, with noble gases. If iodine escaped in step with the noble gases, as the paper's release assumptions suggest, a 0.5 rem dose would mean roughly 8 to 13 rem to an adult's thyroid at the boundary and about twice that for a small child, above the 5 rem child level at which EPA says potassium iodide pills should be considered. The paper does not mention potassium iodide or give a thyroid dose. These are upper bounds from Valar's own ceiling, not predictions: Valar says its accident source term 'substantially exceeds any realistic release scenario,' and the same paper elsewhere puts the boundary dose under 0.1 rem, about 3 to 5 rem to a child's thyroid, at or just under the guide. Valar says DOE approved this agreement; no DOE record of whether it accepted on-site-only planning, or on which number, was found.
Checked: I re-read the pages cited from Valar's safety agreement (11, 36, 37, 45, 54) as page images, along with EPA's 2017 PAG Manual (Table 1-1, p. 6; s. 2.2.1, p. 15) and FGR 11 Table 2.1 (p. 136), all from EPA's own PDFs. The thyroid-to-effective ratios (32.8 for iodine-131, 26.9 for the release mix, about 16 to 18 under DOE's 0.05 thyroid weighting) and the resulting 8 to 13 rem adult and 3 to 5 rem child figures were recomputed in Python on 29 September 2026. Correction 2026-10-01 (precision review): wording made more exact against the cited records.
Five minutes holding Ward One's used fuel: by our math, 8 to 33 times a CT scan's top dose a day after shutdown, not one; Valar has not shown its own math
Valar Atomics is Suing the NRC (Isaiah Taylor, Valar Atomics, 7 April 2025) · Web page, 'Our Vision' section, Ward One paragraph · Discrepancy
What the document says
Valar's April 2025 post describes Ward One as a 100 kWt high-temperature gas reactor using TRISO fuel, with a planned operational lifetime of less than a month, and says: "Our analysis indicates that holding the spent fuel from this system for five minutes" gives the same radiation exposure as a CAT (CT) scan. The post does not say how much fuel is held, how long the reactor ran, how long the fuel cooled, how far it is from the body, or which dose is meant, and the analysis it cites has not been published. The text is the same in the live page (29 September 2026) and in Internet Archive captures of 23 March and 22 July 2026.
Given
P₀ = 100 kW thermal (Valar post, Ward One paragraph)
Fuel = TRISO fuel in a high-temperature gas reactor; fuel mass, enrichment and element type not stated (Valar post, Ward One paragraph)
T = run of 1 to 30 full-power days (the post gives only a planned operating lifetime of less than a month); break-even run length also solved (Valar post; the range is an assumption)
t_hold = 5 minutes = 300 s (Valar post)
f = share of the core's fission products held: the whole core (the literal reading), 1/76 of the core (one of Ward 250's 76 fuel elements, as a stand-in), one 6 cm pebble holding 7 g of uranium (1/35,700 of a 250 kg core), and the break-even share (assumption; Ward 250 NSDA Table 6, p. 52; INL/EXT-20-60236 Table 2)
t = cooling time after shutdown: 1 day to 1 year shown, break-even solved; less than 1 day not modelled (it would give more) (assumption (the post states none))
M = 250 kg of uranium in the core (stand-in; a larger core spreads the fission products more thinly per gram) (Ward 250 NSDA Table 6, p. 52 (a different Valar reactor of the same 100 kW))
E_f = 200 MeV per fission, so 3.12 × 10¹⁰ fissions per watt-second (Lamarsh & Baratta, Introduction to Nuclear Engineering, ch. 3)
y, T½, gamma lines = U-235 thermal cumulative fission yields (e.g. Zr-95 6.50%, Ba-140 6.21%, Te-132 4.30%, I-133 6.70%); half-lives and principal gamma lines of 43 fission products (ENDF/B-VII.1 and JEFF-3.1 yields; ENSDF decay data via NuDat 3)
μ/ρ, μ_en/ρ = graphite and uranium attenuation; air and soft-tissue energy absorption (tissue = 0.990 × water, ICRU-44) (NIST, Hubbell & Seltzer (NISTIR 5632))
E/K_a = 1.00 to 1.43 Sv of effective dose per Gy of air kerma, front-on (AP) exposure (ICRP Publication 74, Table A.17)
Pebble = 6 cm ball: 2.5 cm fuelled zone inside a 0.5 cm fuel-free shell; matrix graphite 1.70 g/cm³ (1.75 used); 7 g of uranium (the HTR-PM value; INL's benchmark pebble holds 9 g) (INL/EXT-20-60236 Rev. 1, Tables 2-3)
d = body reference point 50 cm from the near surface of what is held (30 cm as a sensitivity) (assumption)
CT = 1 to 10 mSv effective dose for typical diagnostic CT; FDA table values from 2 mSv (head) to 16 mSv (coronary CT angiogram) (FDA, What are the Radiation Risks from CT?, text and Table 1)
The radioactive fragments in spent fuel depend on how many uranium atoms were split, that is on power × running time, not on how much uranium was loaded. 200 MeV per fission is the textbook value; 193 MeV would raise every dose below by about 4%. The post's 'less than a month' is taken as a run of 1 to 30 full-power days.
A_i(T, t) = y_i × F × (1 − e^(−λ_i T)) × e^(−λ_i t)
daughters (La-140 from Ba-140, Nb-95 from Zr-95, I-132 from Te-132 and others) by the two-member Bateman equations
Activity of each gamma-emitting fission product after running for T and cooling for t, from U-235 fission yields and half-lives. Gases and iodine are taken to stay inside the intact fuel particles.
S_γ = Σ_i A_i × (gamma energy per decay)_i
whole core, 30-day run: 164 W at 1 day of cooling, 25 W at 30 days, 0.49 W at 1 year
Gamma-ray power given off by the fission products. Cross-check: half of the Way-Wigner decay-heat formula, 0.0622 × [t^−0.2 − (t + T)^−0.2] × 100 kW (t and T in seconds), gives 159 W at 1 day and 21 W at 30 days; gamma rays carry roughly half of fission-product decay heat. At 1 day lanthanum-140 (34%) and iodine-132 (21%) give most of it; at 30 days, lanthanum-140, zirconium-95 and niobium-95.
One CT in five minutes: (1 to 10 mSv) ÷ (5/60 h) = 12 to 120 mSv/h
FDA gives typical effective doses of 1 to 10 mSv for diagnostic CT. The claim is counted as met at any five-minute dose up to 10 mSv, the top of that range.
Piece held = a solid ball of fuel: R = [3 f M ÷ (4π ρ_HM)]^(1/3), ρ_HM = 7 g ÷ 113.1 cm³ = 0.0619 g/cm³, M = 250 kg
whole core R = 98.8 cm; 1/76 of the core R = 23.3 cm; one pebble: 2.5 cm fuelled zone inside a 0.5 cm graphite shell
μ = 1.75 g/cm³ × (μ/ρ)_graphite + ρ_HM × (μ/ρ)_uranium = 0.139 per cm at 0.7 MeV
f is the share of the core's fission products held. Ward One's fuel mass and form are not public, so Valar's Ward 250 figures (250 kg of uranium, 76 fuel elements; a different reactor) and a standard 6 cm pebble stand in. A ball of fuel with no gaps, at a graphite density above INL's 1.70 g/cm³, absorbs more of its own radiation than a real core would, which lowers every dose here.
φ(d) = (S_v ÷ 2μ) ∫₀^(π/2) sin α × (R/d) × (cos β ÷ cos α) × e^(−μs) × (1 − e^(−2μR cos β)) dβ, sin α = (R/d) sin β, s = path through the pebble's fuel-free shell (zero for a uniform ball)
The exact rate at which gamma energy leaves the ball without scattering and reaches a point at distance d from its centre (S_v is the gamma power per cm³). Checks: it reproduces the closed-form contact result, the point-source result far away, and an independent shell integral to six digits.
Whole body: E = 300 s × Σ φ(R + 50 cm) × (μ_en/ρ)_air × (E/K_a)_AP
Hand: H = 300 s × Σ φ(R) × (μ_en/ρ)_tissue, (μ_en/ρ)_tissue = 0.990 × (μ_en/ρ)_water
Effective dose, the quantity FDA uses for CT, is estimated from the air dose at a point 50 cm from the near surface of the fuel, converted with ICRP Publication 74's front-on factors (1.0 to 1.4 Sv per Gy). The hand dose is the dose to the skin where it touches the fuel. It is not an effective dose and is not compared with the CT figure.
30-day run, whole-body dose in five minutes:
whole core: 334 mSv at 1 day of cooling, 54 mSv at 30 days, 0.99 mSv at 1 year
1/76 of the core: 64, 10.3 and 0.19 mSv
one 7 g pebble: 0.77, 0.12 and 0.0024 mSv
Against a 10 mSv CT, the whole core gives 33 times as much at 1 day and 5.4 times at 30 days; one pebble is below FDA's 1 to 10 mSv range. Hand on the fuel at 1 day: 1,379 mSv (core surface), 1,182 mSv (1/76) and 316 mSv (pebble). The whole core and the 1/76 piece (about 100 kg in this model) cannot be lifted; they are shown because the post says 'the spent fuel'.
1-day run, whole-body dose in five minutes:
whole core: 75 mSv at 1 day of cooling, 3.0 mSv at 30 days; 1/76 of the core: 14.6 and 0.56 mSv; one pebble: 0.18 and 0.006 mSv
The low end of 'less than a month'. A shorter or lower-power run gives less (see the break-even run length below).
Solve E(f) = 10 mSv for the share f held:
30-day run, 1 day of cooling: f = 1/1,589, about 157 g of uranium or 22 pebbles' worth in a 250 kg core (a ball 17 cm across)
30-day run, 30 days: f = 1/81 (3.1 kg); 1-day run, 1 day: f = 1/156 (1.6 kg)
for a 1 mSv CT: 8.7 g, 85 g and 50 g
How small a piece makes five minutes equal one CT, as whole-body dose. Held 30 cm from the body instead of 50 cm, the 157 g falls to 48 g; against FDA's highest table value (16 mSv, coronary CT angiogram) it rises to 310 g.
One pebble-sized piece: E = 10 mSv when it holds 1/2,759 of the core's fission products (30-day run, 1 day of cooling)
So the single-pebble result needs a core of at least about 2,760 pebbles' worth of fuel (about 19 kg of uranium at 7 g each). A 250 kg core holds about 35,700. Ward One's core size is not public.
Solve E(t) = 10 mSv for the cooling time t, and E(T) = 10 mSv for the run length T
Whole core: 128 days of cooling after a 30-day run, 9.6 days after a 1-day run (365 and 62 days for a 1 mSv CT). 1/76 of the core: 31 days and 1.4 days. One day after shutdown, the whole core matches a 10 mSv CT only if the reactor ran about 2.1 full-power hours (8.7 kWd).
Hand dose, one 7 g pebble, 30-day run, 1 day of cooling: 316 mSv in five minutes; for the 157 g break-even piece: 833 mSv
Skin dose at the point of contact from gamma rays alone; beta particles would add more if bare fuel were touched. It is a different quantity from a CT's whole-body effective dose. For scale, the NRC's annual limit for the skin of a worker's hands is 500 mSv (10 CFR 20.1201). The pebble's hand dose falls to 10 mSv after about 129 days of cooling (30-day run) or 9 days (1-day run).
Sensitivities, 30-day run, 1 day of cooling (factor on the whole-body dose):
body 30 cm away instead of 50 cm: × 1.4 (core) to × 2.6 (pebble); scattered photons (buildup): × 1.35 to × 2.4
neptunium-239 from U-238 capture: × 1.04 to × 1.12; Ward 250's core volume instead of a solid ball: × 1.1 to × 1.2
9 g pebble (INL benchmark) instead of 7 g: × 1.27; only the 18 strongest emitters counted: × 0.89 to × 0.90
Each choice the post leaves open was set to lower the dose; these factors show how far each could move the results. None of them moves a case across the 10 mSv line at 1 day of cooling.
Results: five minutes holding Ward One's spent fuel (mSv; a typical CT scan is 1 to 10 mSv whole-body)
Reactor ran
Fuel cooled
All the spent fuel, whole-body
One fuel element (1/76), whole-body
One 6 cm pebble, whole-body
Skin of the hand touching that pebble
30 days
1 day
334
64
0.77
316
30 days
7 days
163
31
0.36
147
30 days
30 days
54
10.3
0.12
49
30 days
90 days
14.9
2.9
0.036
15
30 days
1 year
0.99
0.19
0.0024
0.99
7 days
1 day
200
39
0.48
196
7 days
30 days
18
3.5
0.040
16.5
1 day
1 day
75
14.6
0.18
75
1 day
7 days
12.9
2.5
0.029
12
1 day
30 days
3.0
0.56
0.0064
2.7
Whole-body = effective dose, the quantity FDA gives for CT, at a point 50 cm from the near surface of the fuel. The last column is the skin dose where the hand touches the pebble: a different quantity, not comparable with a CT's whole-body figure. 'All the spent fuel' and 'one element' (about 100 kg in this model) could not be lifted by hand; they show what the post's words 'the spent fuel' mean taken literally. Scattered photons, beta particles and neptunium-239 are left out, so every figure is a lower estimate. Run length is in full-power days at 100 kW.
Result
With the post's 100 kWt and a run of 1 to 30 full-power days, five minutes with all of the reactor's spent fuel, 50 cm from the body, gives a whole-body effective dose of about 75 to 334 mSv one day after shutdown and 3 to 54 mSv after 30 days, against FDA's typical 1 to 10 mSv for a CT. It comes down to one 10 mSv CT only for a piece holding no more than about 1/1,600 of the core's fission products one day after a 30-day run (1/156 after a one-day run; 1/81 after 30 days of cooling), about 157 g of uranium or 22 pebbles' worth if the core held 250 kg; or, for the whole core, after about 10 to 128 days of cooling. One 7 g pebble gives about 0.8 mSv whole-body, below FDA's typical CT range, while the skin of the hand touching it receives about 316 mSv in the same five minutes, a different dose quantity. Scattered photons, beta particles and neptunium-239 are left out, so these are lower estimates.
In plain terms: Valar wrote that holding the used fuel from its small Ward One reactor for five minutes would give you about as much radiation as one hospital CT scan. Valar did not show its math. So we did the math, using the numbers Valar did publish: how strong the reactor is (100 kilowatts) and how long it runs (less than a month). Where Valar left things out, we picked the choice that helps Valar, and we show the whole range. What we found: one day after the reactor stops, holding all of its used fuel for five minutes gives your body 8 to 33 times the top of a normal CT scan's range. To get down to one CT scan, you would have to hold only a tiny piece (about 22 small fuel balls after a month-long run), or let the fuel cool for about 10 to 130 days first. Valar's sentence said neither. Even one fuel ball, small enough to stay under one CT scan for your whole body, gives the skin of the hand holding it about 300 millisieverts in those five minutes. U.S. rules let a radiation worker get 500 millisieverts to the hands in a whole year. So our math does not back up Valar's sentence. It only matches in a special case Valar never described. Why time and power matter: a reactor makes its radioactive leftovers while it runs. The stronger it runs and the longer it runs, the more leftovers pile up. Some fade in days. Others, like cesium-137, take about 30 years just to lose half their strength, and those keep piling up the longer a reactor runs. Ward One was planned to be small and to run less than a month, which is why its fuel could cool to CT-scan levels within months. Valar says Ward 250, the reactor now in Emery County, will run about the same amount: 30 full days of power spread across a year. But Ward 250's own safety paper lets its fuel make up to ten times that much energy, and its goal of running 80% of the time for a year points to about that much. Ten times the energy means about ten times the long-lasting leftovers, and fuel that takes longer to cool. Valar's founder has talked about hundreds of reactors in Carbon and Emery counties, as the local paper reported, and Valar says it wants to build 'tens, then hundreds, then thousands' of reactors a year. NPR reported on September 30, citing a Valar proposal to federal regulators, that its 'Project Beehive' near Price would hold about 456 small reactors, each making 25 megawatts of electricity: at least 250 times the 100 kilowatts Ward 250 runs at, along with places to store nuclear waste. Each one would make used fuel. The CT-scan comparison describes only the smallest, shortest case.
What would settle it: Valar publishing its own calculation: how much fuel is held, how long the reactor ran, how long the fuel cooled, how far it is from the body, and which kind of dose it means. Until then, the sentence on its website is a claim without its math.
Radiation Dose from X-Ray and CT Exams (RadiologyInfo.org (Radiological Society of North America and American College of Radiology), 2025-04-15) · Effective radiation dose in adults (table, and its note citing ICRP Publication 103 on partial-body exposure)
NuDat 3: half-lives, gamma-ray energies and intensities (ENSDF) (National Nuclear Data Center, Brookhaven National Laboratory) · ENSDF half-lives and gamma lines, entered from the evaluated data; NNDC's data pages answered our requests with 'too many requests', so they could not be archived for this check
Checked: Two independent calculations worked out the doses, each entering the nuclear data separately; a third check re-derived every case in one program and traced each difference between them to a stated modelling choice (distance measured from the fuel's centre or surface, density and size of the fuel ball, how many nuclides were counted, a point-source shortcut). With matching choices the third check reproduces both within 5%, and the two calculations' gamma-ray data agree within about 4%. The total gamma output agrees with the standard decay-heat formula within 3% one day after shutdown. Valar's post was compared across the live page (29 September 2026) and Internet Archive captures of 23 March and 22 July 2026: the text is identical. FDA's CT figures, EIA, Valar's Ward 250 safety paper, the INL pebble benchmark and the NRC's 10 CFR 20.1201 were read from archived copies. The fission-yield, decay and photon-attenuation tables come from the standard evaluated data (ENDF/ENSDF, NIST); the IAEA and NIST servers refuse automated copies and NNDC's answered 'too many requests', so those tables were not re-checked against an archived copy. An error of a few percent in them would move the results by about the same few percent; none of the sensitivity checks moves any case across the CT line. Valar has not published the analysis its post cites, so which reading it used cannot be checked.